We have a project to monitor how individual use different devices in daily life. The goal includes what time use which device, how they switch different device, etc..
Current personal devices can be classified by two parts: desktop, mobile. The desktop contains laptop, desktop computer. It can be divided by platform to Windows, Mac, Linux. The mobile contains smart phone, tablet, e-book, etc. It can be divided to Android, iOS, Windows Phone, etc. Now, we only focus on Android because it has largest market cap.
So, we first need monitor or get the usage information for laptops. This blog will focus on an approach to infer the usage for Mac OS from it logs.
You can find more information about OSX Log Files Structure and Applications.
We use system.log to infer user’s usage.The log file path is:
/var/log/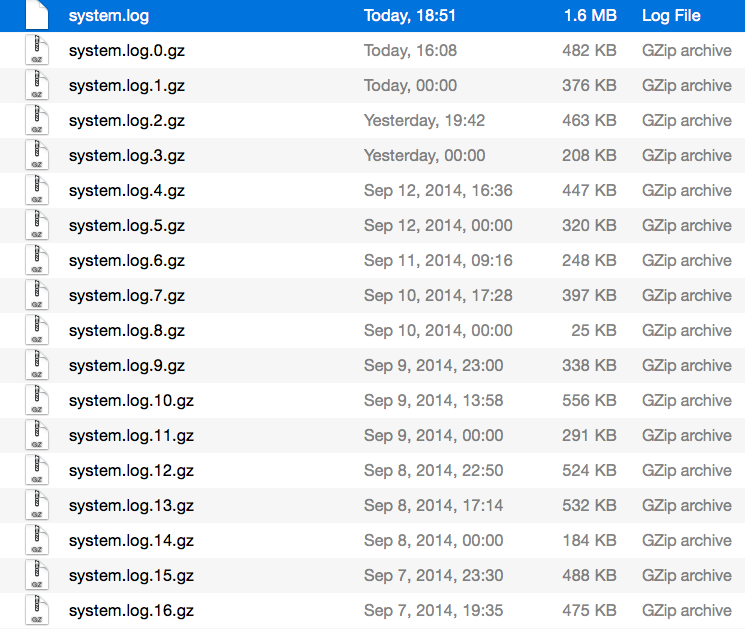
System.log is the current log; the system.log.0.gz, system.log.1.gz, etc. are the previous log files compressed by gzip.
Here are some lines from my Mac:
Sep 14 17:21:34 xcv58 lsuseractivityd[16919]: ADVERTISING:5485ef383f0bb401c3 ...
Sep 14 17:21:34 xcv58 sharingd[397]: 17:21:34.831 : Starting Handoff advertis...
Sep 14 17:21:34 xcv58 blued[65]: Advertisinng resolvable 12  ret 0   client w...
Sep 14 17:21:36 --- last message repeated 1 time ---                         ...
Sep 14 17:21:36 xcv58 nsurlstoraged[371]: Error: stepSQLStatement:toCompletio...
Sep 14 17:21:36 xcv58 nsurlstoraged[371]: writeDBwithCachedResponse-ERROR wit...
Sep 14 17:21:41 xcv58 lsuseractivityd[16919]: PICKING: -/as the current item-...
Sep 14 17:21:41 xcv58 lsuseractivityd[16919]: ADVERTISING: Removing advertise...
The first part is date and time; then we will see the user name, process/task name and related pid; the last part is the acutal log description.
We can have such assumption: the log entry num within a period is postively related usage of computer.
To achieve this goal, we need extract the num of log entry within per minute. The shell script is:
cat system.log | sed -e '/^[[:blank:]].*/d' | grep -o "^\w\+[ \t]\d\{2,2\}[ \t]\d\{2,2\}:\d\d" | sort | uniq -c | sed -e 's/^ *\([0-9]\{1,\}\) \(.*\)/\2,\1/'Please use this Dropbox Share Folder to play with it, if you don’t have Mac.
This shell script will print statistics like:
Sep 10 12:00,145
Sep 10 12:01,129
Sep 10 12:02,41
Sep 10 12:03,70
Sep 10 12:04,54
Sep 10 12:05,150
Sep 10 12:06,32
Sep 10 12:07,11
Sep 10 12:08,5
Sep 10 12:09,4
Sep 10 12:10,3
Sep 10 12:11,24
Sep 10 12:12,8
Sep 10 12:13,8
Sep 10 12:14,2
Sep 10 12:15,4
Sep 10 12:16,2
Sep 10 12:17,13
Sep 10 12:18,4
Sep 10 12:19,5
Sep 10 12:20,4
Sep 10 12:21,4
Sep 10 12:22,9
Sep 10 12:23,2
Sep 10 12:24,6
Sep 10 12:25,5
Sep 10 12:26,6
Sep 10 12:27,7
Sep 10 12:28,2
Sep 10 12:29,2
Sep 10 12:30,3
Sep 10 12:31,3
Sep 10 12:32,7
Sep 10 12:33,8
Sep 10 12:34,2
Sep 10 12:35,2
Sep 10 12:36,6
Sep 10 12:37,5
Sep 10 12:38,4
Sep 10 12:39,10
Sep 10 12:40,3
Sep 10 12:41,4
Sep 10 12:42,9
Sep 10 12:43,30
Sep 10 12:44,15
Sep 10 12:45,10
Sep 10 12:46,4
Sep 10 12:47,5
Sep 10 12:48,3
Sep 10 12:49,5
Sep 10 12:50,3
Sep 10 12:51,7
Sep 10 12:52,5
Sep 10 12:53,6
Sep 10 12:54,4
Sep 10 12:55,3
Sep 10 12:56,2
Sep 10 12:57,9
Sep 10 12:58,2
Sep 10 12:59,4
Sep 10 13:00,11
Sep 10 13:01,8
Sep 10 13:02,5
Sep 10 13:03,6
Sep 10 13:04,3
Sep 10 13:05,2
Sep 10 13:06,15
Sep 10 13:07,9
Sep 10 13:08,12
Sep 10 13:09,4
Sep 10 13:10,3
Sep 10 13:11,29
Sep 10 13:12,8
Sep 10 13:13,3
Sep 10 13:14,4
Sep 10 13:15,10
Sep 10 13:16,2
Sep 10 13:17,9
Sep 10 13:18,4
Sep 10 13:19,6
Sep 10 13:20,4
Sep 10 13:21,4
Sep 10 13:22,8
Sep 10 13:23,3
Sep 10 13:24,6
Sep 10 13:25,3
Sep 10 13:26,6
Sep 10 13:27,6
Sep 10 13:28,5
Sep 10 13:29,2
Sep 10 13:30,5
Sep 10 13:31,3
Sep 10 13:32,8
Sep 10 13:33,5
Sep 10 13:34,4
Sep 10 13:35,2
Sep 10 13:36,6
Sep 10 13:37,5
Sep 10 13:38,4
Sep 10 13:39,4
Sep 10 13:40,5
Sep 10 13:41,2
Sep 10 13:42,10
Sep 10 13:43,7
Sep 10 13:44,4
Sep 10 13:45,4
Sep 10 13:46,4
Sep 10 13:47,6
Sep 10 13:48,26
Sep 10 13:49,53
Sep 10 13:50,335
Sep 10 13:51,90
Sep 10 13:52,144
Sep 10 13:53,137
Sep 10 13:54,93
Sep 10 13:55,27
Sep 10 13:56,3
Sep 10 13:57,10
Sep 10 13:58,8
The whole file is sharing via Google Drive. And the Google interactive chart of this data.
Below is an interactive chart created by vis.js. I divided the log by every ten minutes. It roughly reflects my daily usage on Mac.
Those data can confirm the assumption, but we still need log from more people. Please contact me i@xcv58.com if you’re interested to participate.
